Saturday, February 20, 2010

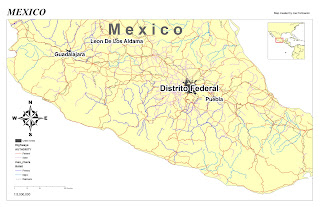
Module 5 - GIS Data Search


I didn't have any problems finding the map data. Though I did run into hard disk space problems when I uploaded the data files to the server. The projection used is Transverse Mercator.


Sunday, February 7, 2010

Haiti Earthquake Magnitude Map


This map shows the earthquake intensity around different locations in Haiti. I found this map at the USGS website. It can help geologists determine the different locations where the highest intensity quakes occured. Relief worked could also use this map to determine where the most medical resources and food supplies should go to.

Week 4 - Projections


This map shows the area in square miles for Alachua, Escambia, Polk and Dade counties. The map uses graduated colors to distinguish the area in square miles

Sunday, January 31, 2010


Map #1 - this may shows the population scale of Mexico using a color ramp.


Joe Perkowski


Map #2 - includes roads, railways, state/federal highways, rivers/streams, and population of 1000000+ urban center. I did have an issue with the scale of my layout. I couldn't get the 1:5,000,000 to display correctly. Not sure if I changed something within ArcMap to cause it.


Joe Perkowski

Week #3 Intro to GIS Maps


Map #3 Elevation map for Mexico

I used brown/tan colors for this map because of the fact Mexico isn't known for its high altitude mountains and snow covered caps.